AI engineer · In progress
Can a tool read mental state without the data ever leaving the machine?
FlowState — On-Device Cognitive Load Estimation
Estimates cognitive load and burnout risk from behavioural telemetry, with every model running locally. Nothing leaves the machine.
- Role
- AI engineer
- Built with
- Python · Behavioural Telemetry · On-Device ML · Privacy Engineering

A tool that estimates cognitive load and burnout risk from behavioural telemetry, with every model running locally on the user’s machine. Nothing leaves the device. That constraint is the point of the project: the signals most useful for inferring mental state are precisely the ones users should be most reluctant to upload, so the architecture removes the upload entirely rather than promising to handle it responsibly.
Problem
Inferring cognitive state requires fine-grained behavioural data — activity patterns, timing, interaction rhythms. That data is intimate, and the conventional architecture of shipping it to a server for scoring asks the user to trust a promise. A privacy policy is not an architectural guarantee.
Approach
Models run entirely in user space on the local machine, so the telemetry never crosses the network and there is no server-side store to breach or subpoena. This costs the things centralized training would give you: no cross-user population baseline, no model improvement from aggregate data, and inference bounded by whatever hardware the user happens to have. The design accepts all three, on the view that a tool for monitoring mental state is not one users should have to take on trust. This is an in-progress prototype and has not been validated against any clinical or psychometric measure of cognitive load.
Screens
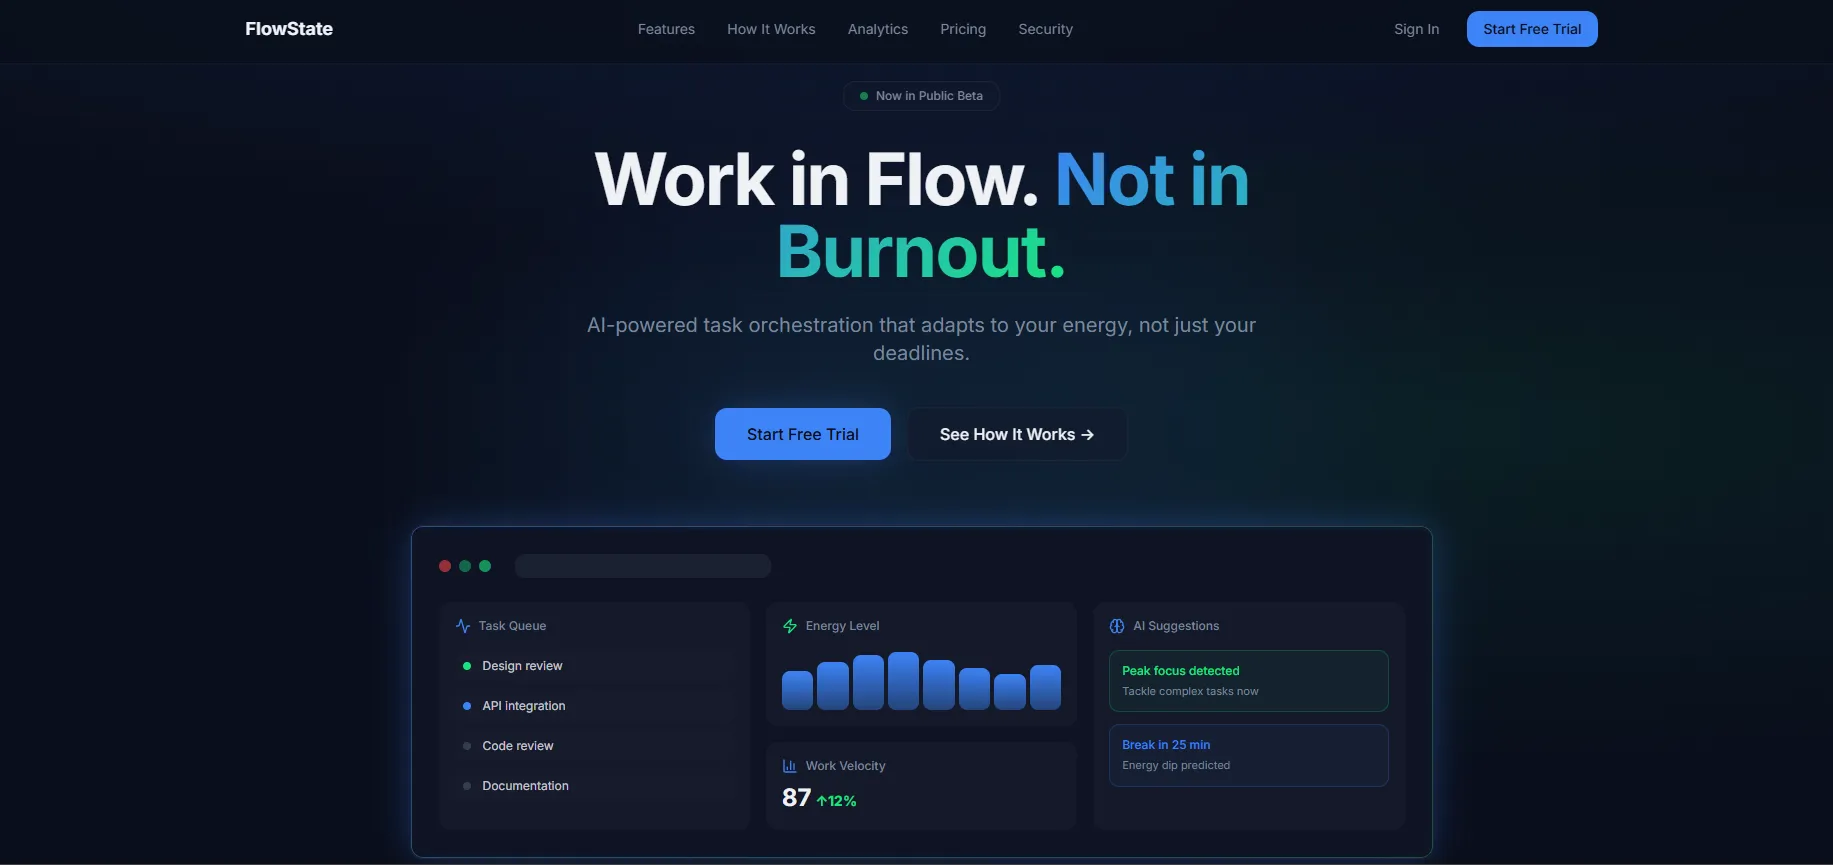
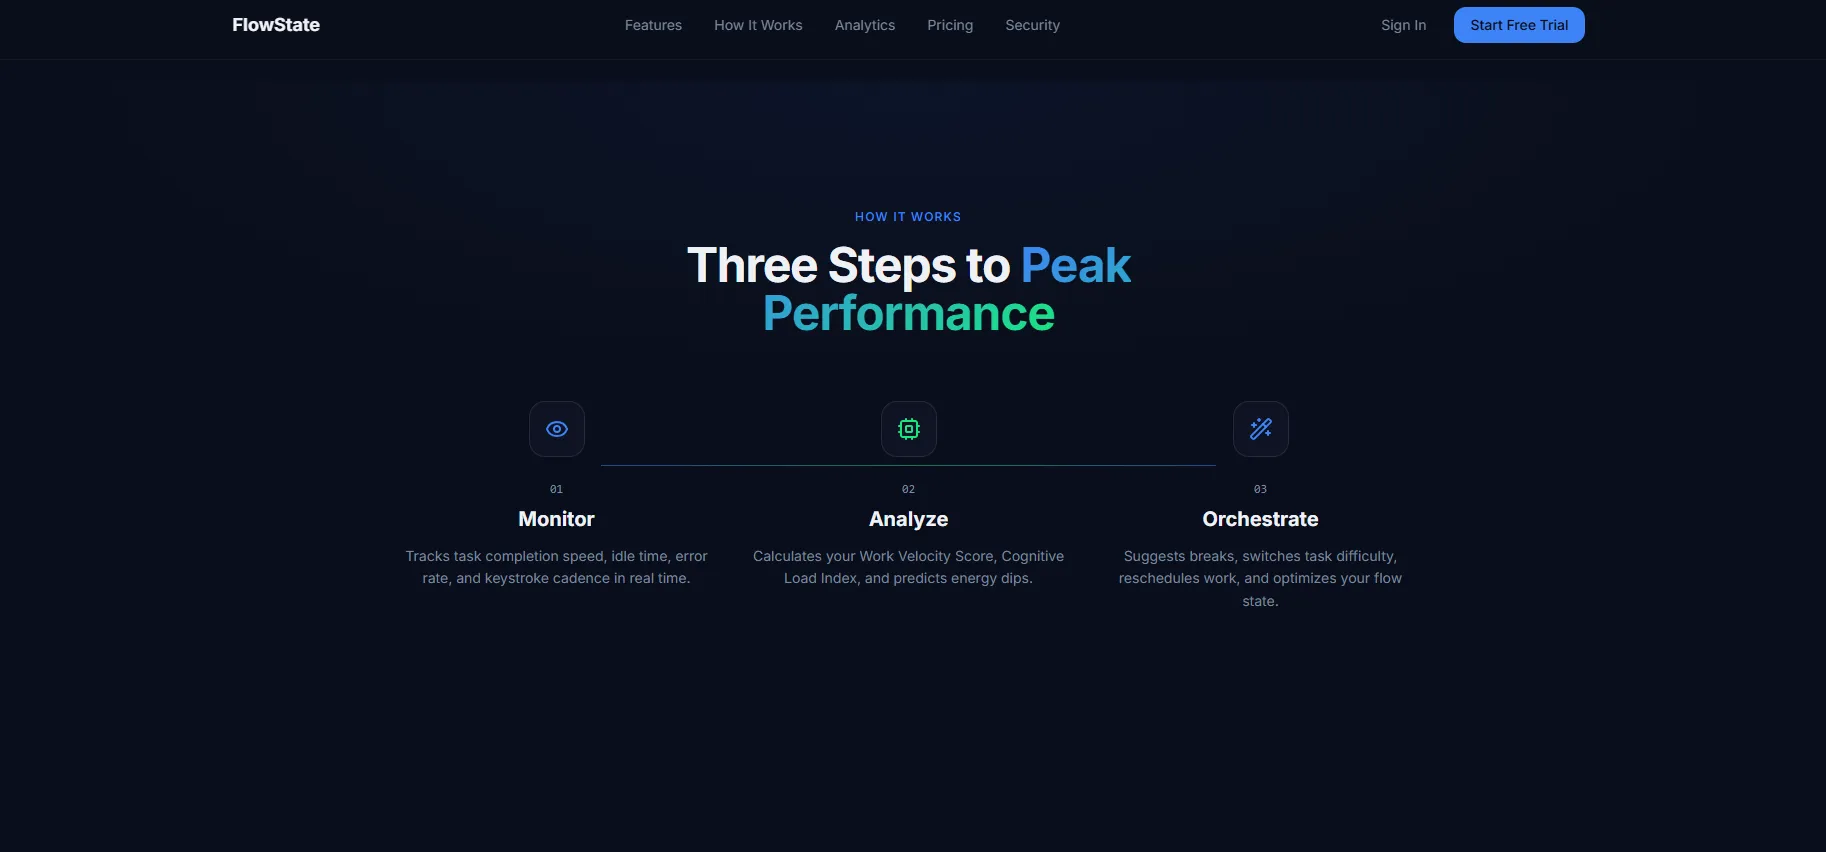
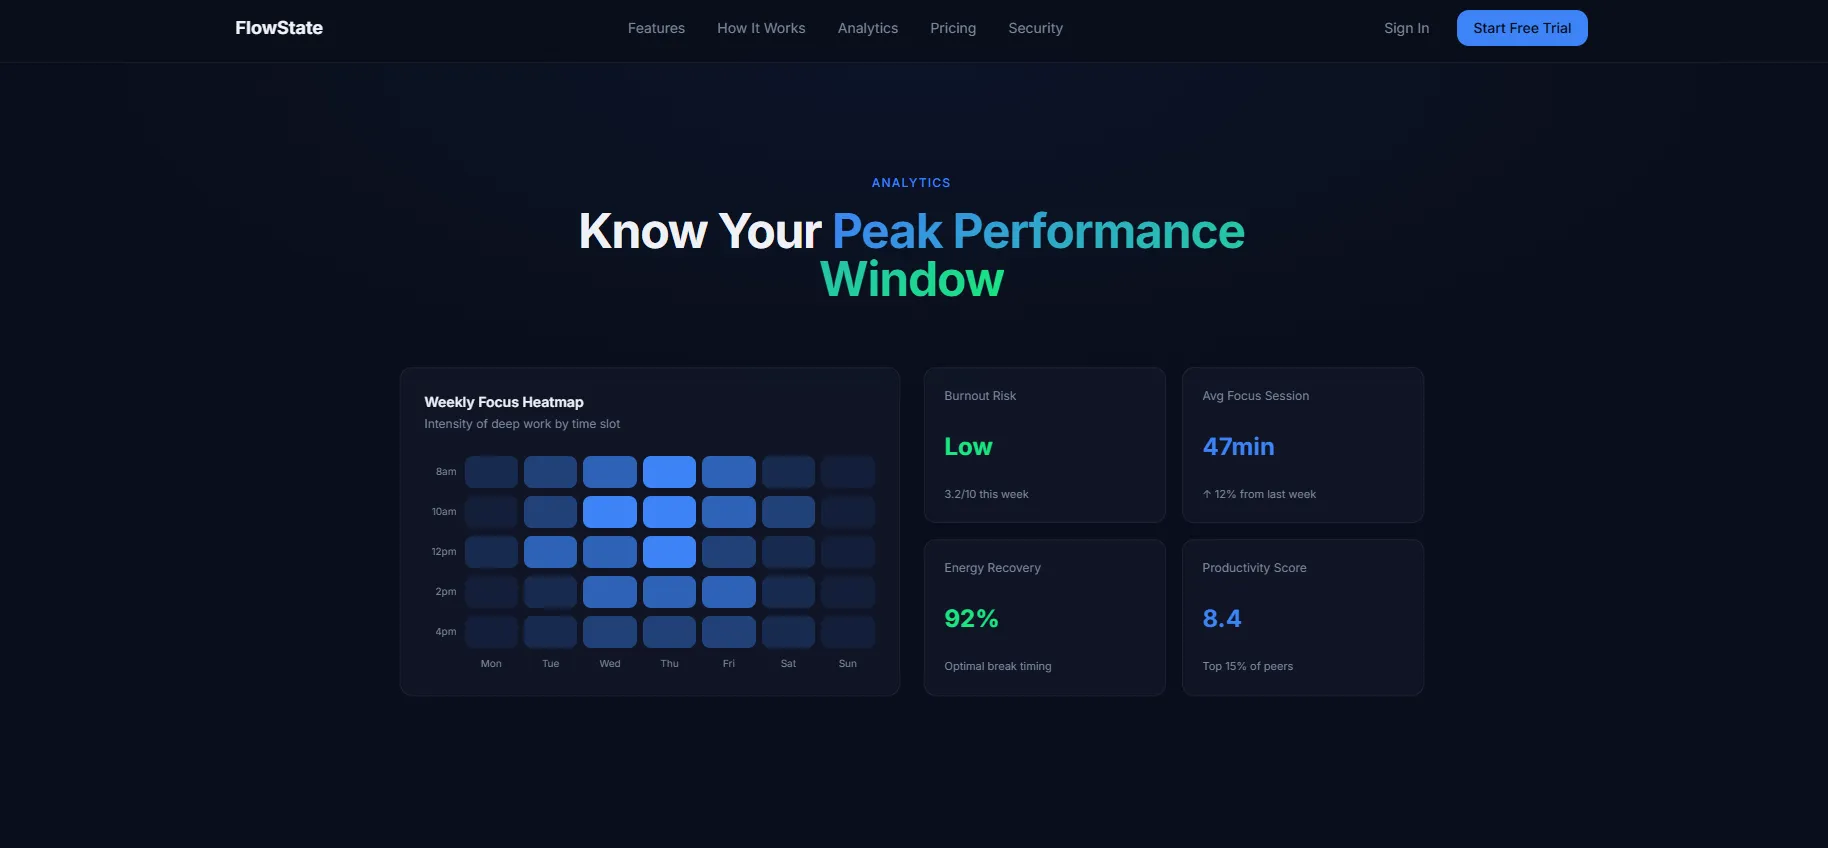

Watch the walkthrough on YouTube Walkthrough of the on-device estimator and the weekly view.